ใช้ h5py เพื่อบันทึกอาเรย์ numpy เป็นไฟล์ hdf5
เขียนเมื่อ 2018/01/04 23:52
แก้ไขล่าสุด 2021/09/28 16:42
ในเนื้อหา numpy บทที่ 39 ได้อธิบายถึงการบันทึกอาเรย์ลงไฟล์ https://phyblas.hinaboshi.com/numa39
แต่ว่านอกจากวิธีนั้นแล้วยังมีอีกวิธีที่น่าสนใจ นั่นคือบันทึกในรูปแบบไฟล์ hdf5
hdf คือรูปแบบการจัดเก็บไฟล์แบบไบนารีชนิดหนึ่ง ปัจจุบันใช้รุ่นที่เรียกว่า hdf5 ชื่อสกุลไฟล์มักเขียนเป็น .h5
สามารถใช้ในไพธอนได้โดยใช้มอดูล hdf5 ซึ่งสามารถติดตั้งได้ง่ายด้วย pip
จากนั้นก็สามารถใช้ได้ทันที มอดูลนี้ที่จริงนอกจากเรื่องบันทึกและเปิดไฟล์แล้วก็ยังใช้ทำอะไรอย่างอื่นได้อีก แต่ในที่นี้จะไม่พูดถึง จะอธิบายแค่เรื่องการใช้เพื่อบันทึกและเปิดไฟล์เท่านั้น
การใช้งานจะคล้ายกับการใช้คำสั่ง np.savez ของ numpy คือใช้เซฟหลายอาเรย์ลงในไฟล์เดียว แต่มีวิธีการเขียนที่ยุ่งยากกว่าหน่อย
เริ่มจากการบันทึกอาเรย์ลงไฟล์ เขียนได้ดังนี้
ขั้นตอนเริ่มจากเปิดไฟล์ขึ้นมาด้วย h5py.File จากนั้นก็ทำการบันทึกไฟล์ โดยปิดท้ายจะต้องปิดไฟล์ด้วยเมธอด .close ด้วย คล้ายกับคำสั่งเปิดปิดไฟล์ด้วย open ซึ่งเป็นฟังก์ชันพื้นฐานของไพธอน (รายละเอียด https://phyblas.hinaboshi.com/tsuchinoko17)
ดังนั้นจะเขียนในรูป with ก็ได้เช่นกัน เพื่อความสะดวกไม่ต้องพะวงเรื่องปิดไฟล์ตอนท้าย ดังนั้น ๔ บรรทัดสุดท้ายนั้นอาจเขียนแทนด้วย ๓ บรรทัดตามนี้
อาร์กิวเมนต์ตัวแรกคือที่อยู่และชื่อของไฟล์ ส่วนตัวที่ ๒ คือชนิดของการเปิดไฟล์ ในที่นี้เปิดเพื่อเขียน ดังน้นคือ w
ในระหว่างที่ไฟล์เปิดอยู่ก็ใช้เมธอด .create_dataset เพื่อป้อนข้อมูลลงไฟล์ โดยอาร์กิวเมนต์ตัวแรกคือชื่อของชุดข้อมูล ตั้งเป็นอะไรก็ได้ จากนั้นใส่อาเรย์ที่ต้องการบันทึกลงไปที่คีย์เวิร์ด data
จากนั้นเวลาเปิดอ่านไฟล์ก็ทำในลักษณะคล้ายกัน คือใช้ h5py.File เหมือนกัน แต่เลือกโหมดเป็น r หรือจะไม่ใส่ r ก็ได้เพราะ r คือค่าตั้งต้นอยู่แล้ว
เวลาที่อ่านข้อมูลจากไฟล์ก็เปิดในลักษณะเช่นเดียวกับดิกชันนารี คือใส่ชื่อของชุดข้อมูล แต่จะต้องต่อด้วย [:] ลงไปด้วย ไม่เช่นนั้นข้อมูลจะยังไม่ถูกอ่านเข้าไปในตัวแปรทันที
เขียนได้ดังนี้
สำหรับเรื่องความเร็วนั้นลองมาทดสอบกันดู
เขียนโปรแกรมสำหรับเปรียบเทียบความเร็วของการใช้วิธีการต่างๆในการบันทึก โดยจะเปรียบเทียบที่อาเรย์ขนาดต่างๆกันด้วย เพราะผลที่ได้อาจไม่เหมือนกัน
ในที่นี้มี ๔ วิธี คือใช้ np.save np.savez h5py และ fits สกุลไฟล์ คือ .npy .npz .h5 และ .fits
คำสั่ง np.save จะบันทึกแยกไฟล์ ไฟล์ละอาเรย์ ส่วน np.savez จะเป็นการบันทึกรวมกี่อาเรย์ก็ได้ในไฟล์เดียว เช่นเดียวกับ h5
ส่วน fits เป็นไฟล์ข้อมูลไบนารีรูปแบบนึง สามารถบันทึกและเปิดได้ผ่านมอดูล astropy แต่ในที่นี้จะไม่อธิบายรายละเอียด แค่จะยกมาใช้เทียบเฉยๆ
เขียนได้ดังนี้ สามารถดูแล้วเปรียบเทียบลักษณะการเขียนของแต่ละวิธีไปด้วยได้

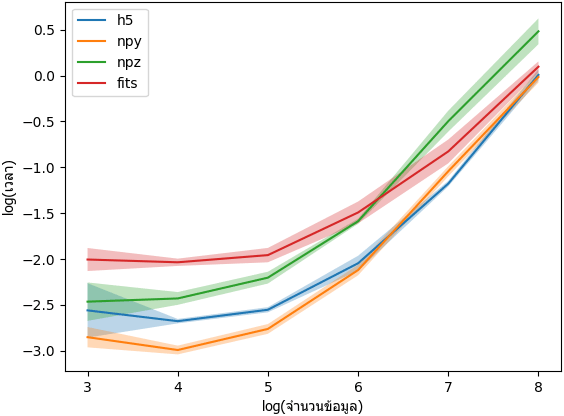
จากผลการวัดจะเห็นได้ว่าใช้ h5 จะช้ากว่าใช้ npy ถ้าขนาดอาเรย์เล็ก แต่จะกลายเป็นเร็วพอๆกันขึ้นมาเมื่อขนาดอาเรย์ใหญ่
แต่ h5 จะสะดวกกว่าเพราะเก็บอาเรย์ทั้งหมดลงในไฟล์เดียว เหมือนกับ npz แต่ว่าหากใช้ npz จะช้ากว่า ดังนั้นใช้ h5 จึงคุ้ม
จากนั้นลองเปรียบเทียบตอนเปิดอ่านข่้อมูลดู
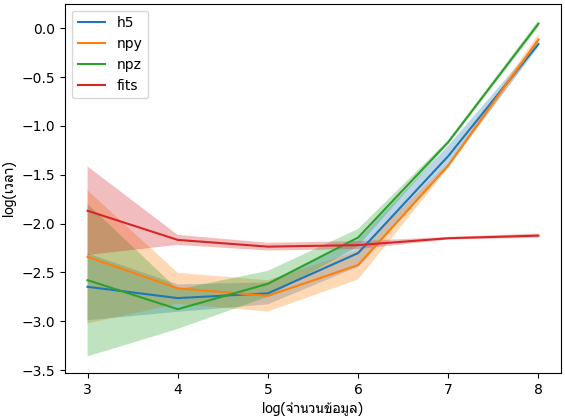
ผลที่ได้จะเห็นว่า h5 ช้ากว่า npy เฉพาะตอนอาเรย์เล็ก แต่เร็วพอๆกันตอนอาเรย์ใหม่ และ npz ก็ช้าสุดอีกเช่นกัน
แต่ที่เร็วสุดกลับเป็น fits ซึ่งไม่ว่าข้อมูลจะใหญ่แค่ไหนก็ใช้เวลาไม่ค่อยต่างกัน
โดยสรุปก็คือ ข้อดีของการใช้ h5py ก็คือสามารถบันทึกและเปิดไฟล์ที่ประกอบด้วยอาเรย์ทีละหลายตัวได้เหมือนกับ np.savez แต่มีความเร็วเท่ากับ np.save ดังนั้นเหมาะที่จะใช้แทน np.savez
อ้างอิง
แต่ว่านอกจากวิธีนั้นแล้วยังมีอีกวิธีที่น่าสนใจ นั่นคือบันทึกในรูปแบบไฟล์ hdf5
hdf คือรูปแบบการจัดเก็บไฟล์แบบไบนารีชนิดหนึ่ง ปัจจุบันใช้รุ่นที่เรียกว่า hdf5 ชื่อสกุลไฟล์มักเขียนเป็น .h5
สามารถใช้ในไพธอนได้โดยใช้มอดูล hdf5 ซึ่งสามารถติดตั้งได้ง่ายด้วย pip
pip install h5pyจากนั้นก็สามารถใช้ได้ทันที มอดูลนี้ที่จริงนอกจากเรื่องบันทึกและเปิดไฟล์แล้วก็ยังใช้ทำอะไรอย่างอื่นได้อีก แต่ในที่นี้จะไม่พูดถึง จะอธิบายแค่เรื่องการใช้เพื่อบันทึกและเปิดไฟล์เท่านั้น
การใช้งานจะคล้ายกับการใช้คำสั่ง np.savez ของ numpy คือใช้เซฟหลายอาเรย์ลงในไฟล์เดียว แต่มีวิธีการเขียนที่ยุ่งยากกว่าหน่อย
เริ่มจากการบันทึกอาเรย์ลงไฟล์ เขียนได้ดังนี้
import h5py
import numpy as np

xx = np.random.random(1000000)
yy = np.random.random([1000,1000])
h5f = h5py.File('hy.h5','w')
h5f.create_dataset('x',data=xx)
h5f.create_dataset('y',data=yy)
h5f.close()
ขั้นตอนเริ่มจากเปิดไฟล์ขึ้นมาด้วย h5py.File จากนั้นก็ทำการบันทึกไฟล์ โดยปิดท้ายจะต้องปิดไฟล์ด้วยเมธอด .close ด้วย คล้ายกับคำสั่งเปิดปิดไฟล์ด้วย open ซึ่งเป็นฟังก์ชันพื้นฐานของไพธอน (รายละเอียด https://phyblas.hinaboshi.com/tsuchinoko17)
ดังนั้นจะเขียนในรูป with ก็ได้เช่นกัน เพื่อความสะดวกไม่ต้องพะวงเรื่องปิดไฟล์ตอนท้าย ดังนั้น ๔ บรรทัดสุดท้ายนั้นอาจเขียนแทนด้วย ๓ บรรทัดตามนี้
with h5py.File('hy.h5','w') as h5f:
    h5f.create_dataset('x',data=xx)
    h5f.create_dataset('y',data=yy)
อาร์กิวเมนต์ตัวแรกคือที่อยู่และชื่อของไฟล์ ส่วนตัวที่ ๒ คือชนิดของการเปิดไฟล์ ในที่นี้เปิดเพื่อเขียน ดังน้นคือ w
ในระหว่างที่ไฟล์เปิดอยู่ก็ใช้เมธอด .create_dataset เพื่อป้อนข้อมูลลงไฟล์ โดยอาร์กิวเมนต์ตัวแรกคือชื่อของชุดข้อมูล ตั้งเป็นอะไรก็ได้ จากนั้นใส่อาเรย์ที่ต้องการบันทึกลงไปที่คีย์เวิร์ด data
จากนั้นเวลาเปิดอ่านไฟล์ก็ทำในลักษณะคล้ายกัน คือใช้ h5py.File เหมือนกัน แต่เลือกโหมดเป็น r หรือจะไม่ใส่ r ก็ได้เพราะ r คือค่าตั้งต้นอยู่แล้ว
เวลาที่อ่านข้อมูลจากไฟล์ก็เปิดในลักษณะเช่นเดียวกับดิกชันนารี คือใส่ชื่อของชุดข้อมูล แต่จะต้องต่อด้วย [:] ลงไปด้วย ไม่เช่นนั้นข้อมูลจะยังไม่ถูกอ่านเข้าไปในตัวแปรทันที
เขียนได้ดังนี้
h5f = h5py.File('hy.h5')
xx = h5f['x'][:]
yy = h5f['y'][:]
h5f.close()
สำหรับเรื่องความเร็วนั้นลองมาทดสอบกันดู
เขียนโปรแกรมสำหรับเปรียบเทียบความเร็วของการใช้วิธีการต่างๆในการบันทึก โดยจะเปรียบเทียบที่อาเรย์ขนาดต่างๆกันด้วย เพราะผลที่ได้อาจไม่เหมือนกัน
ในที่นี้มี ๔ วิธี คือใช้ np.save np.savez h5py และ fits สกุลไฟล์ คือ .npy .npz .h5 และ .fits
คำสั่ง np.save จะบันทึกแยกไฟล์ ไฟล์ละอาเรย์ ส่วน np.savez จะเป็นการบันทึกรวมกี่อาเรย์ก็ได้ในไฟล์เดียว เช่นเดียวกับ h5
ส่วน fits เป็นไฟล์ข้อมูลไบนารีรูปแบบนึง สามารถบันทึกและเปิดได้ผ่านมอดูล astropy แต่ในที่นี้จะไม่อธิบายรายละเอียด แค่จะยกมาใช้เทียบเฉยๆ
เขียนได้ดังนี้ สามารถดูแล้วเปรียบเทียบลักษณะการเขียนของแต่ละวิธีไปด้วยได้
import numpy as np
import pandas as pd
import matplotlib.pyplot as plt
import time,h5py,os
from astropy.io import fits

chuefile = 'xy'

def saveh5f(x,y,n):
    h5f = h5py.File(chuefile+'%d.h5'%n,'w')
    h5f.create_dataset('x',data=x)
    h5f.create_dataset('y',data=y)
    h5f.close()

def savenpy(x,y,n):
    np.save(chuefile+'_x%d.npy'%n,x)
    np.save(chuefile+'_y%d.npy'%n,y)

def savenpz(x,y,n):
    np.savez(chuefile+'%d.npz'%n,x=x,y=y)

def savefits(x,y,n):
    if(os.path.isfile(chuefile+'%d.fits'%n)): os.remove(chuefile+'%d.fits'%n)
    fits.HDUList([fits.PrimaryHDU(x),fits.ImageHDU(y)]).writeto(chuefile+'%d.fits'%n)


for f in [saveh5f,savenpy,savenpz,savefits]:
    ttt = []
    ttt_std = []
    nnn = 10**np.arange(3,9)
    for n in nnn:
        x = np.random.random(n)
        y = np.random.random(int(n/10))
        tt = []
        for i in range(5):
            t1 = time.time()
            f(x,y,n)
            tt.append(time.time()-t1)
        ttt.append(tt)
    ttt = np.log10(np.array(ttt))
    std = np.array(ttt).std(1)
    mean = np.array(ttt).mean(1)
    nnn = np.log10(nnn)
    plt.plot(nnn,mean)
    plt.fill_between(nnn,mean-std,mean+std,alpha=0.3)

plt.xlabel('log(จำนวนข้อมูล)',family='Tahoma')
plt.ylabel('log(เวลา)',family='Tahoma')
plt.legend(['h5','npy','npz','fits'])
plt.show()
จากผลการวัดจะเห็นได้ว่าใช้ h5 จะช้ากว่าใช้ npy ถ้าขนาดอาเรย์เล็ก แต่จะกลายเป็นเร็วพอๆกันขึ้นมาเมื่อขนาดอาเรย์ใหญ่
แต่ h5 จะสะดวกกว่าเพราะเก็บอาเรย์ทั้งหมดลงในไฟล์เดียว เหมือนกับ npz แต่ว่าหากใช้ npz จะช้ากว่า ดังนั้นใช้ h5 จึงคุ้ม
จากนั้นลองเปรียบเทียบตอนเปิดอ่านข่้อมูลดู
def loadh5f(n):
    with h5py.File(chuefile+'%d.h5'%n,'r') as h5f:
        x = h5f['x'][:]
        y = h5f['y'][:]
    return x,y

def loadnpy(n):
    x = np.load(chuefile+'_x%d.npy'%n)
    y = np.load(chuefile+'_y%d.npy'%n)
    return x,y

def loadnpz(n):
    xy = np.load(chuefile+'%d.npz'%n)
    return xy['x'],xy['y']

def loadfits(n):
    hdulist = fits.open(chuefile+'%d.fits'%n)
    return hdulist[0].data,hdulist[1].data

for f in [loadh5f,loadnpy,loadnpz,loadfits]:
    ttt = []
    ttt_std = []
    nnn = 10**np.arange(3,9)
    for n in nnn:
        tt = []
        for i in range(5):
            t1 = time.time()
            x,y = f(n)
            tt.append(time.time()-t1)
        ttt.append(tt)
    ttt = np.log10(np.array(ttt))
    std = np.array(ttt).std(1)
    mean = np.array(ttt).mean(1)
    nnn = np.log10(nnn)
    plt.plot(nnn,mean)
    plt.fill_between(nnn,mean-std,mean+std,alpha=0.3)

plt.xlabel('log(จำนวนข้อมูล)',family='Tahoma')
plt.ylabel('log(เวลา)',family='Tahoma')
plt.legend(['h5','npy','npz','fits'])
plt.show()
ผลที่ได้จะเห็นว่า h5 ช้ากว่า npy เฉพาะตอนอาเรย์เล็ก แต่เร็วพอๆกันตอนอาเรย์ใหม่ และ npz ก็ช้าสุดอีกเช่นกัน
แต่ที่เร็วสุดกลับเป็น fits ซึ่งไม่ว่าข้อมูลจะใหญ่แค่ไหนก็ใช้เวลาไม่ค่อยต่างกัน
โดยสรุปก็คือ ข้อดีของการใช้ h5py ก็คือสามารถบันทึกและเปิดไฟล์ที่ประกอบด้วยอาเรย์ทีละหลายตัวได้เหมือนกับ np.savez แต่มีความเร็วเท่ากับ np.save ดังนั้นเหมาะที่จะใช้แทน np.savez
อ้างอิง