opencv-python เบื้องต้น บทที่ ๑๕: การวิเคราะห์องค์ประกอบของเส้นเค้าโครง
เขียนเมื่อ 2020/06/28 19:13
แก้ไขล่าสุด 2024/02/22 10:23
ต่อจาก บทที่ ๑๔
บทนี้จะแนะนำฟังก์ชันที่นำเส้นเค้าโครงมาคำนวณเอาค่าอะไรต่างๆ รวมทั้งการเอารูปร่างต่างๆมาทาบเข้ากับเค้าโครง
บทนี้จะใช้ฟังก์ชันสำหรับวาดรูปของ matplotlib เป็นหลัก รายละเอียดอ่านได้ใน numpy & matplotlib บทที่ ๓๖
การหาพื้นที่ภายใน
หากมีเส้นเค้าโครงแล้วต้องการคำนวณหาพื้นที่ที่ปิดล้อมอยู่ภายในอาจทำได้โดยใช้ฟังก์ชัน cv2.contourArea()
ตัวอย่าง
import cv2
import numpy as np
import matplotlib.pyplot as plt

cnt = np.array([[[1,0]],
                [[-1,0]],
                [[-2,2]],
                [[0,3]],
                [[2,2]]])

contourArea = cv2.contourArea(cnt)
ax = plt.axes(aspect=1,xlim=[-3,3],ylim=[4,-1])
plt.title('อาณาเขต = %.2f ตารางพิกเซล'%contourArea,family='Tahoma')
ax.add_patch(plt.Polygon(cnt[:,0],fc='y',ec='k'))
plt.grid(ls=':',c='r')
plt.show()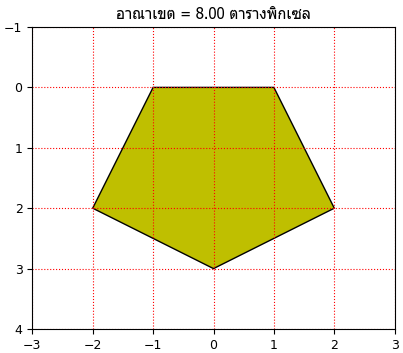
การหาความยาวเส้นทั้งหมด
ความยาวรวมของเส้นเค้าโครงทั้งหมดสามารถหาได้โดยใช้ฟังก์ชัน cv2.arcLength()
ค่าที่ต้องใส่ในฟังก์ชันนี้มี ๒ ตัว ตัวแรกคือเส้นเค้าโครง ส่วนอีกตัวเป็นค่า True หรือ False ที่บอกว่าเส้นนี้เป็นวงปิดหรือไม่ สำหรับเส้นเค้าโครงจะเป็นเส้นปิดอยู่แล้ว ใส่ True แต่ถ้าใช้กับเส้นที่ไม่ใช่วงปิดก็ใส่ False
ตัวอย่าง
cnt = np.array([[[0,0]],
                [[0,3]],
                [[4,0]]])

arcLength = cv2.arcLength(cnt,True)
ax = plt.axes(aspect=1,xlim=[-1,5],ylim=[-1,4])
plt.title('ความยาวเส้นล้อม = %.2f พิกเซล'%arcLength,family='Tahoma')
ax.add_patch(plt.Polygon(cnt[:,0],fc='c',ec='b'))
plt.grid(ls=':',c='g')
plt.show()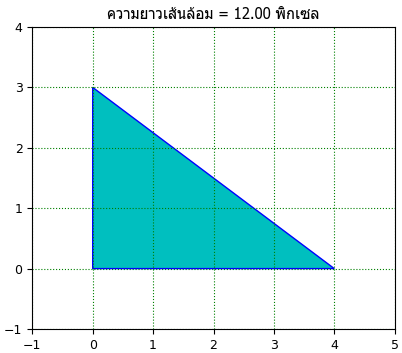
การหากรอบสี่เหลี่ยมแสดงขอบเขต
หากต้องการหาขอบเขตว่าเส้นเค้าโครงนี้มีค่าต่ำสุดตั้งแต่เท่าไหร่ถึงเท่าไหร่อาจใช้ฟังก์ชัน cv2.boundingRect()
ฟังก์ชันนี้จะคืนค่าออกมาเป็น (x ซ้ายสุด, y บนสุด, กว้าง, สูง)
ตัวอย่าง
cnt = np.array([[[0,0]],
                [[-100,300]],
                [[300,100]]])

x,y,w,h = cv2.boundingRect(cnt)
ax = plt.axes(aspect=1,xlim=[-200,400],ylim=[400,-100])
ax.add_patch(plt.Polygon(cnt[:,0],fc='g',ec='m'))
ax.add_patch(plt.Rectangle((x,y),w,h,fc='w',ec='k',alpha=0.6))
plt.grid(ls=':',c='y')
plt.show()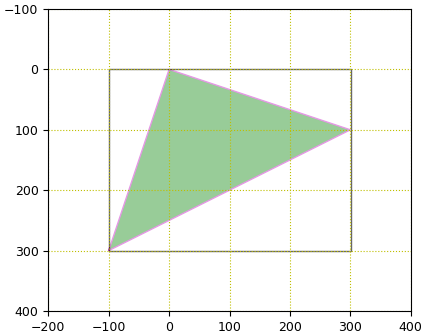
การหาวงกลมล้อมรอบ
สามารถหาวงกลมที่ปิดล้อมรอบเส้นเค้าโครงได้พอดีได้โดยใช้ฟังก์ชัน cv2.minEnclosingCircle()
ฟังก์ชันนี้จะให้ค่าคืนมาเป็น ((xใจกลาง, yใจกลาง), รัศมี)
ตัวอย่าง
cnt = np.array([[[0,0]],
                [[-10,30]],
                [[10,40]],
                [[30,10]],
                [[10,10]]])

(x,y),r = cv2.minEnclosingCircle(cnt)
ax = plt.axes(aspect=1,xlim=[-20,40],ylim=[50,-10])
ax.add_patch(plt.Polygon(cnt[:,0],fc='r',ec='k'))
ax.add_patch(plt.Circle((x,y),r,fc='g',ec='m',alpha=0.6))
plt.grid(ls=':',c='c')
plt.show()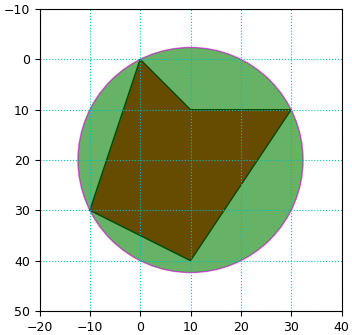
การทาบด้วยวงรี
cv2.fitEllipse() ใช้หาวงรีที่ทาบเข้ากับเค้าโครงได้พอดี ค่าที่ได้คืนมาจะเป็น ((x ใจกลาง,y ใจกลาง),(กว้าง, สูง), มุมเอียง)
ตัวอย่าง
import matplotlib as mpl

cnt = np.array([[[0,0]],
                [[-20,50]],
                [[20,70]],
                [[60,60]],
                [[40,20]]])

(x,y),(w,h),mum = cv2.fitEllipse(cnt)
ax = plt.axes(aspect=1,xlim=[-50,80],ylim=[100,-30])
ax.add_patch(plt.Polygon(cnt[:,0],fc='b',ec='r'))
ax.add_patch(mpl.patches.Ellipse((x,y),w,h,angle=mum,fc='c',ec='g',alpha=0.6))
plt.grid(ls=':',c='m')
plt.show()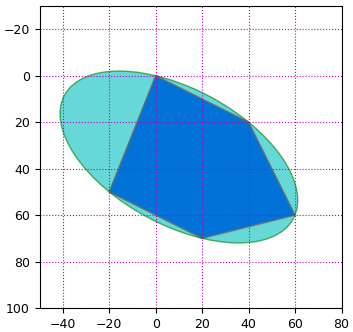
การคำนวณโมเมนต์
cv2.moments() ใช้คำนวณค่าโมเมนต์ (moment) ของเค้าโครง
ในที่นี้จะไม่เขียนถึงรายละเอียดอาจอ่านได้ในวิกิพีเดีย
ค่าโมเมนต์ที่ได้มานี้เอาไว้ใช้คำนวณค่าที่เกี่ยวกับการจัดเรียง เช่น จุดเซนทรอยด์ (centroid) อาจคำนวณได้จาก cx,cy = (M10/M00,M01/M00)
ตัวอย่าง
x = np.arange(0,80,10,dtype=np.float32)
y = 16-((x-40)**2)/25
cnt = np.vstack([x,y]).T.reshape(-1,1,2)
# คำนวณค่าโมเมนต์
m = cv2.moments(cnt)
print(m)
# คำนวณจุดเซนทรอยด์
cx = m['m10']/m['m00']
cy = m['m01']/m['m00']
print('cx = ',cx)
print('cy = ',cy)

ax = plt.axes(aspect=1)
# วาดเส้นเค้าโครง
ax.add_patch(plt.Polygon(cnt[:,0],fc='y',ec='m',alpha=0.3))
# วาดจุดมุม
plt.scatter(x,y,c='r')
# วาดจุดเซนทรอยด์
plt.scatter(cx,cy,s=100,c='b',marker='x')
plt.grid(ls=':',c='c')
plt.show(){'m00': 2240.0, 'm10': 78400.0, 'm01': -32853.33333333333, 'm20': 3285333.333333333, 'm11': -933333.3333333333, 'm02': 927573.3333333333, 'm30': 152880000.0, 'm21': -36023466.666666664, 'm12': 23716693.333333332, 'm03': -26576896.0, 'mu20': 541333.333333333, 'mu11': 216533.33333333326, 'mu02': 445724.4444444445, 'mu30': 2.9802322387695312e-08, 'mu21': -2995911.1111111147, 'mu12': -2396728.88888889, 'mu03': 102096.59259258956, 'nu20': 0.10788690476190468, 'nu11': 0.04315476190476188, 'nu02': 0.08883219954648526, 'nu30': 1.254960517316626e-16, 'nu21': -0.012615628100805144, 'nu12': -0.010092502480644108, 'nu03': 0.00042992351733354094}
cx = 35.0
cy = -14.666666666666664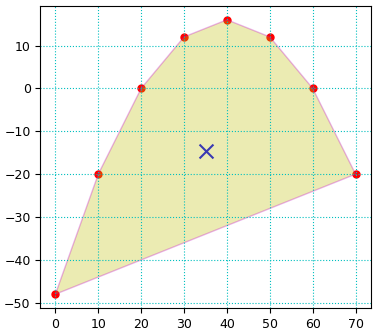
การหาว่าจุดอยู่ในหรือนอกเค้าโครงและอยู่ห่างหรือลึกเท่าใด
หากมีจุดจุดหนึ่งกับเส้นเค้าโครงอันหนึ่งแล้วอยากรู้ว่าจุดนั้นอยู่ในเส้นเค้าโครงนั้นหรือเปล่าอาจใช้ฟังก์ชัน cv2.pointPolygonTest()
ค่าที่ต้องใส่ในฟังก์ชันนี้คือ
| ลำดับที่ | ชื่อ | ค่าที่ต้องใส่ | ชนิดข้อมูล |
|---|---|---|---|
| 1 | contour | เส้นเค้าโครง | np.array |
| 2 | pt | ตำแหน่งจุด | tuple ของ float |
| 3 | measureDist | ถ้า True จะคะนวณระยะทางด้วย ถ้า False จะแค่บอกว่าอยู่นอกหรือใน |
True/False |
ถ้าให้ measureDist เป็น False จะได้ค่า -1 เมื่ออยู่ด้านนอก และ 1 เมื่ออยู่ด้านใน
ถ้าใส่เป็น True นอกจากจะหาว่าอยู่ในหรือนอกแล้วยังให้ค่าว่าอยู่ในหรือห่างไปไกลเท่าใดด้วย
ตัวอย่าง ลองใช้ภาพเค้าโครงนี้ แล้วสุ่มจุดขึ้นมาจำนวนหนึ่ง ดูว่าอยู่ข้างในเค้าโครงหรือไม่ ถ้าอยู่ข้างในให้เป็นสีเขียว ถ้าอยู่ข้างนอกให้เป็นสีม่วง แล้วก็แสดงค่าระยะห่างที่ได้ออกมาด้วย

a15c07.png
pika = cv2.imread('a15c07.png',0)
# หาเค้าโครง
contour,_ = cv2.findContours(pika,cv2.RETR_LIST,cv2.CHAIN_APPROX_SIMPLE)
cnt = contour[0]

plt.figure(figsize=[6,6])
plt.imshow(cv2.cvtColor(pika,cv2.COLOR_GRAY2RGB))
# สุ่มจุดขึ้นมา
xy = np.random.randint(100,500,[20,2])
for x,y in xy:
    ptest = cv2.pointPolygonTest(cnt,(x,y),True)
    if(ptest<0):
        c = 'm' # อยู่นอก
    else:
        c = 'g' # อยู่ใน
    plt.scatter(x,y,10,c=c)
    plt.text(x,y,' %.1f'%ptest,color=c)
plt.show()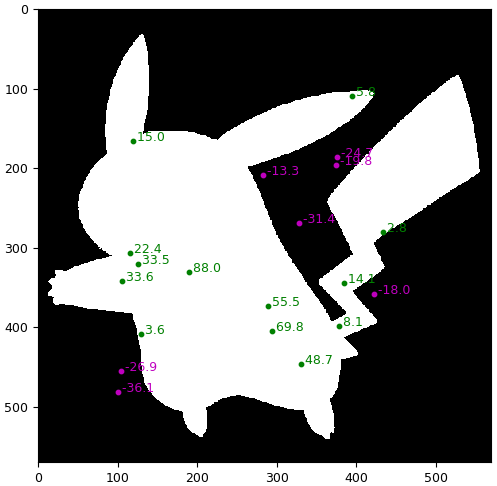
การเปรียบเทียบรูปร่าง
ฟังก์ชัน cv2.matchShapes() ใช้เปรียบเทียบเค้าโครง ๒ รูปว่ามีความเหมือนหรือต่างกันแค่ไหนโดยใช้หลักของโมเมนต์หู (Hu moment) ยิ่งเหมือนกันยิ่งค่าน้อย
ถ้าหากว่าเป็นรูปร่างที่เหมือนกันที่ถูกย่อขยายขนาดหรือหมุนไปก็จะถือว่าเป็นรูปเดียวกัน ก็จะได้ค่า 0 เช่นกัน
ค่าที่ต้องใส่ในฟังก์ชัน
| ลำดับที่ | ชื่อ | ค่าที่ต้องใส่ | ชนิดข้อมูล |
|---|---|---|---|
| 1 | contour1 | เส้นเค้าโครง 1 | np.array |
| 2 | contour2 | เส้นเค้าโครง 2 | np.array |
| 3 | method | วิธีการคำนวณ | int |
| 4 | parameter | พารามิเตอร์ | float |
ตัวแรกและตัวที่ ๒ คือเค้าโครงที่ต้องการเปรียบเทียบ ตัวที่ ๓ คือวิธีการ อาจใส่เป็น 1,2,3 ค่าที่ได้จะต่างกันไป
นอกจากนี้ยังต้องใส่ตัวที่ ๔ คือค่าพารามิเตอร์ ซึ่งในที่นี้จะใส่เป็นตัวเลขค่าอะไรก็ไม่ได้มีผล เพราะไม่ได้ถูกใช้ แต่ก็บังคับใส่เลยต้องใส่ ไม่เช่นนั้นฟังก์ชันจะไม่ทำงาน
ตัวอย่าง ลองสร้างเค้าโครงขึ้นมา ๔ รูป แล้วเปรียบเทียบกันทีละคู่
theta = np.radians(np.arange(0,360,15,np.float32))
r = [2+np.cos(theta*30),
     2+np.sin(theta*30),
     (2+np.cos(theta*30))*0.8,
     1.5+np.cos(theta*30)]

contour = []
for i in range(4):
    x = r[i]*np.cos(theta)
    y = r[i]*np.sin(theta)
    contour.append(np.vstack([x,y]).T.reshape(-1,1,2))

plt.figure(figsize=[6,6])
for i in range(4):
    for j in range(i,4):
        match = cv2.matchShapes(contour[i],contour[j],1,0)
        ax = plt.subplot(4,4,1+5*i+(j-i),aspect=1,xlim=[-3,3],ylim=[-3,3],xticks=[],yticks=[])
        plt.text(0,3,'%.4f'%match,ha='center')
        ax.add_patch(plt.Polygon(contour[i][:,0],fc='m',ec='k'))
        ax.add_patch(plt.Polygon(contour[j][:,0],fc='g',ec='k',alpha=0.5))
plt.tight_layout(0)
plt.show()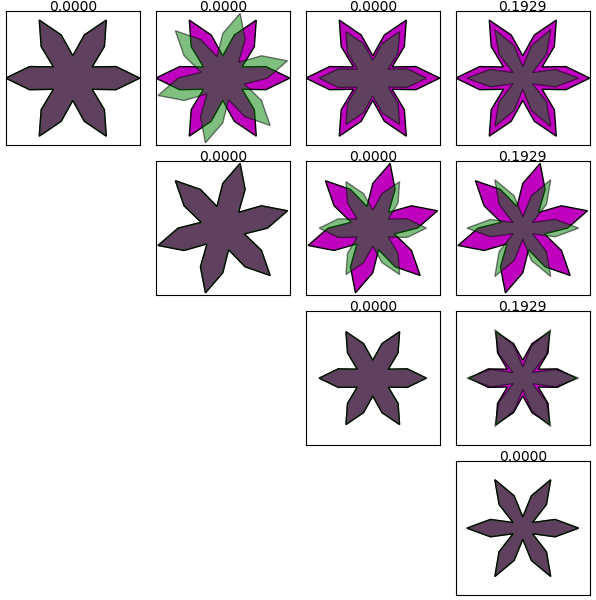
ในที่นี้ภาพที่ ๒ คือภาพที่ ๑ ที่หมุนไป ส่วนภาพที่ ๓ คือเอาภาพที่ ๑ มาย่อขนาด ดังนั้นเมื่อคำนวณเปรียบเทียบกับก็จะได้เป็น 0 ส่วนภาพที่ ๔ นั้นมีรูปร่างต่างออกไปเล็กน้อย จึงได้ค่าไม่เป็น 0
เมื่อใช้ฟังก์ชันนี้แล้ว ก็จะทำให้สามารถเปรียบเทียบได้ว่าเค้าโครงมีความคล้ายคลึงกันแค่ไหน
อ่านบทถัดไป >> บทที่ ๑๖
-----------------------------------------
囧囧囧囧囧囧囧囧囧囧囧囧囧囧囧囧囧囧囧囧囧囧囧囧囧
หมวดหมู่
-- คอมพิวเตอร์ >> เขียนโปรแกรม >> opencv-- คอมพิวเตอร์ >> เขียนโปรแกรม >> python >> numpy
-- คอมพิวเตอร์ >> เขียนโปรแกรม >> python >> matplotlib