manim บทที่ ๒๐: การวาดเส้นกราฟและแผนภูมิแท่ง
เขียนเมื่อ 2021/03/13 12:28
แก้ไขล่าสุด 2021/09/28 16:42
ต่อจาก บทที่ ๑๙
หลังจากที่บทที่แล้วได้พูดถึงการวางระบบพิกัดลงบนภาพแล้ว ในบทนี้จะพูดถึงการวาดเส้นกราฟและแผนภูมิแท่งลงไป
การวาดเส้นกราฟ
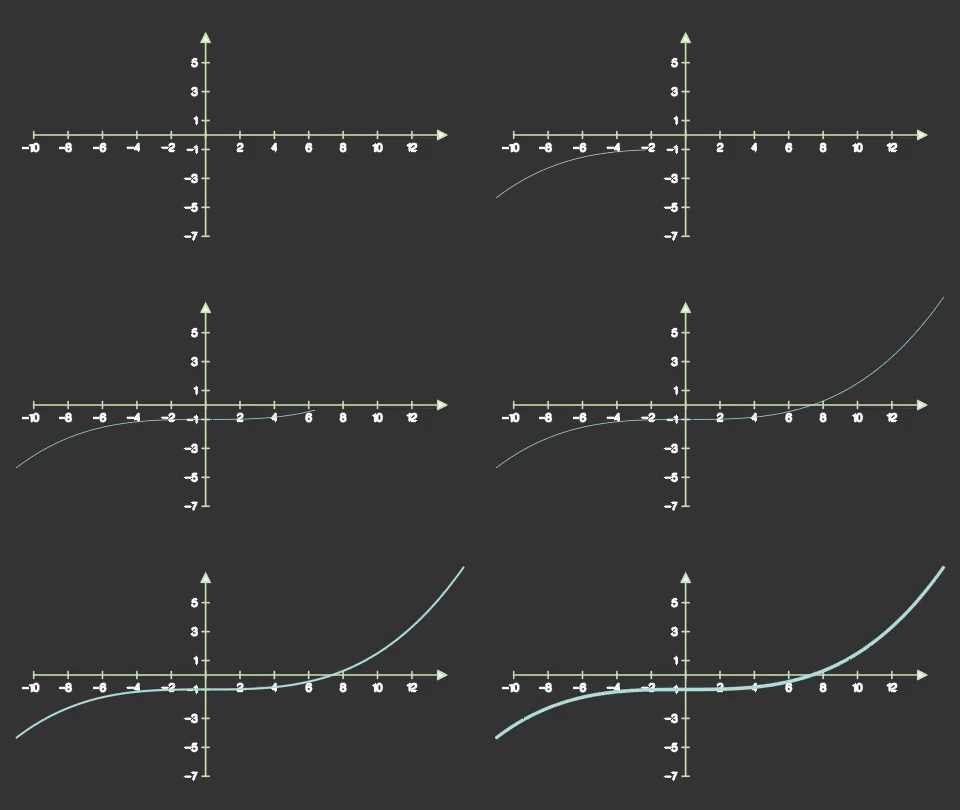
ออบเจ็กต์ของแกนกราฟที่สร้างจากคลาส Axes มีเมธอด .get_graph() เอาไว้ใช้วาดกราฟของฟังก์ชันที่ต้องการ
ตัวอย่าง
import manimlib as mnm
import numpy as np
import math

class Manimala(mnm.Scene):
    def construct(self):
        axes = mnm.Axes(x_range=(-10,14,2),
                        y_range=(-7,7,2),
                        axis_config={'stroke_width':5,
                                     'stroke_color':'#c7e5ab'})
        axes.add_coordinate_labels()
        sengraph = axes.get_graph(lambda x: 0.0025*x**3-1,
                                  x_range=(-11,15,0.1),
                                  color='#abe0e5',
                                  stroke_width=15)
        self.add(axes)
        self.play(
            mnm.Write(sengraph),
            run_time=1
        )
ในที่นี้ x_range ใส่เป็น (x ต่ำสุด, x สูงสุด, ระยะห่างแต่ละจุด)
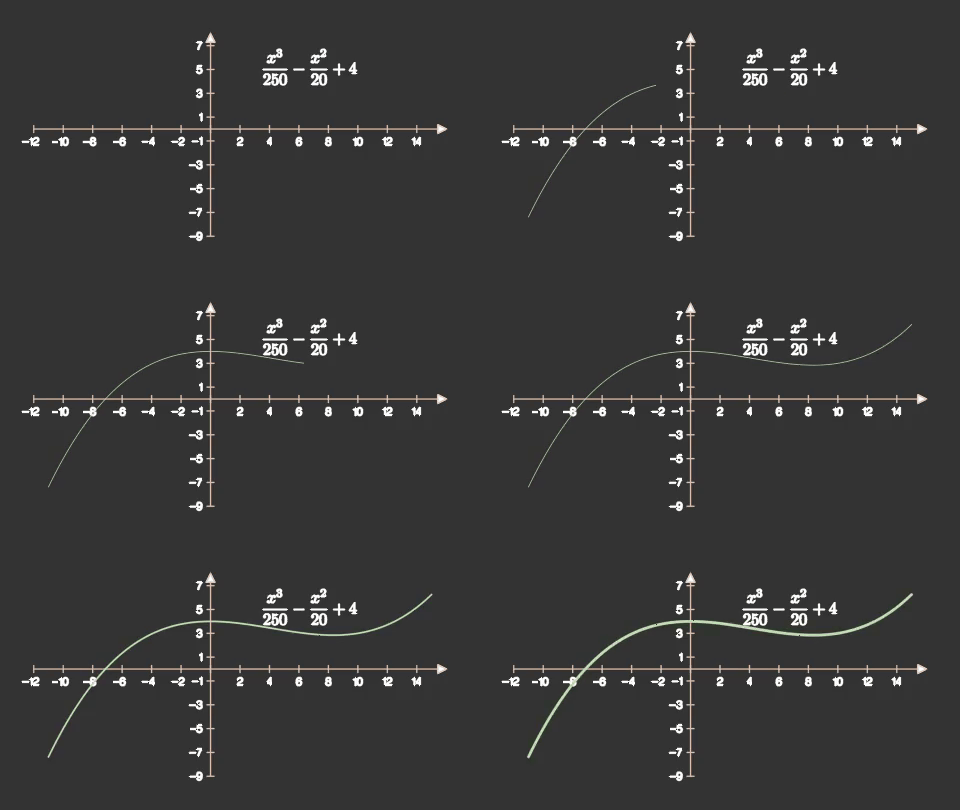
เมธอด .get_graph_label() เอาไว้เขียนข้อความลงบนกราฟที่วาด
ตัวอย่าง
import manimlib as mnm

class Manimala(mnm.Scene):
    def construct(self):
        axes = mnm.Axes(x_range=(-12,16,2),
                        y_range=(-9,8,2),
                        axis_config={'stroke_width':4,
                                     'stroke_color':'#e5c3ab'})
        axes.add_coordinate_labels()
        sengraph = axes.get_graph(lambda x: 0.004*x**3-0.05*x**2+4,
                                  x_range=(-11,15,0.1),
                                  color='#bce5ab',
                                  stroke_width=12)
        label = axes.get_graph_label(sengraph,r'\frac{x^3}{250}-\frac{x^2}{20}+4')
        self.add(axes,label)
        self.play(
            mnm.Write(sengraph),
            run_time=1
        )
FunctionGraph
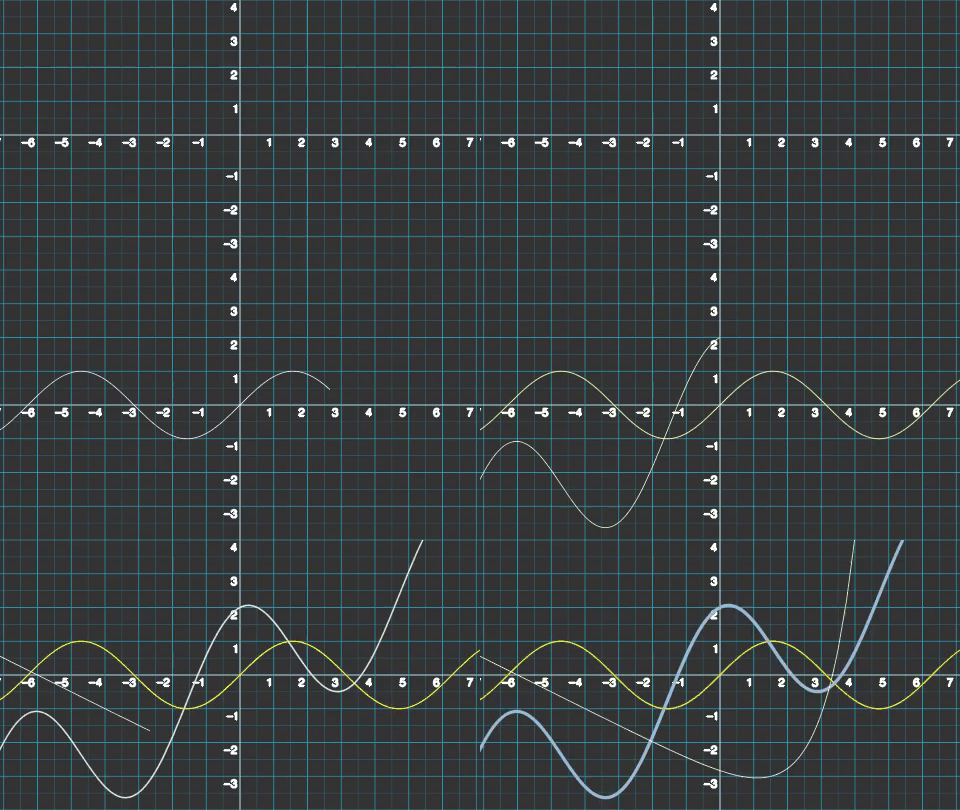
คลาส FunctionGraph เอาไว้สร้างกราฟของฟังก์ชันที่ต้องการลงบนพิกัดของตำแหน่งภายในภาพ
ตัวอย่าง
import manimlib as mnm
import numpy as np
class Manimala(mnm.Scene):
def construct(self):
axes = mnm.NumberPlane() # ใส่กราฟพิกัดตำแหน่งในภาพ
axes.add_coordinate_labels()
# วาดกราฟในระบบพิกัดตำแหน่งในภาพขึ้นมา ๓ เส้น
sengraph = mnm.VGroup(mnm.FunctionGraph(np.sin),
mnm.FunctionGraph(lambda x:np.cos(x)*2+x/2,
stroke_width=10,
color='#99bbdd'),
mnm.FunctionGraph(lambda x:np.exp(x)/6-x/2-3))
self.add(axes)
self.play(
mnm.Write(sengraph),
run_time=1,
lag_ratio=0.5
)
ParametricCurve
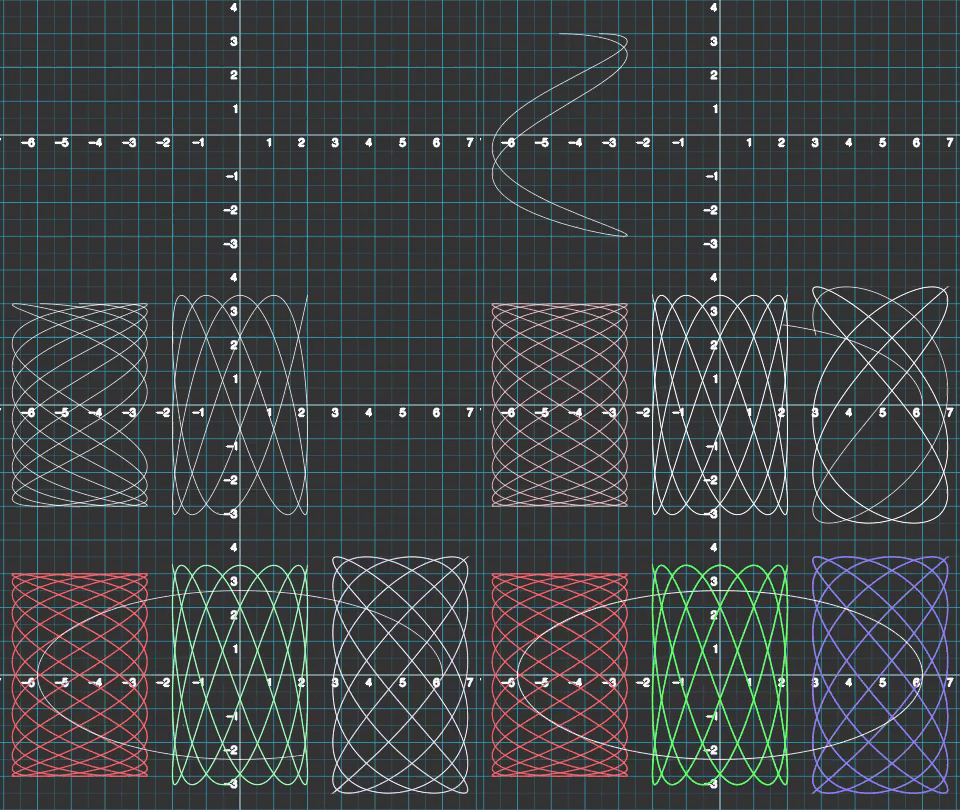
คลาส ParametricCurve ใช้วาดกราฟที่มีค่าพิกัดเป็น x(t),y(t),z(t) โดย t เป็นตัวแปรหนึ่งที่ไล่ค่าในช่วงของเขตที่กำหนด (กำหนดของเขตที่คีย์เวิร์ด t_range)
ฟังก์ชันที่จะใช้กับ ParametricCurve คือฟังก์ชันที่รับตัวแปร t มาแล้วคืนค่าเป็นอาเรย์ของค่า [x,y,z] (ในที่นี้แสดง ๒ มิติจะใช้แค่ x,y)
ตัวอย่าง
import manimlib as mnm
import numpy as np

class Manimala(mnm.Scene):
    def construct(self):
        axes = mnm.NumberPlane()
        axes.add_coordinate_labels()
        def f1(t):
            return np.array([2*np.sin(t*12)-4.75,3*np.cos(t*5),0])
        def f2(t):
            return np.array([2*np.cos(t*7),3.25*np.cos(t*12),0])
        def f3(t):
            return np.array([2*np.sin(t*13)+4.75,3.5*np.sin(t*9),0])
        def f4(t):
            return np.array([6*np.cos(t),2.5*np.sin(t),0])
        t_range = [0,np.pi*2,np.pi/100]
        sengraph = mnm.VGroup(mnm.ParametricCurve(f1,t_range,color='#ff6666'),
                              mnm.ParametricCurve(f2,t_range,color='#66ff66'),
                              mnm.ParametricCurve(f3,t_range,color='#6666ff'),
                              mnm.ParametricCurve(f4,t_range))

        self.add(axes)
        self.play(
            mnm.Write(sengraph),
            run_time=1,
            lag_ratio=0.2
        )
BarChart
คลาส BarChart ใช้วาดแผนภูมิแท่ง
ตัวอย่างการใช้
import manimlib as mnm
import numpy as np

class Manimala(mnm.Scene):
    def construct(self):
        axes = mnm.BarChart(np.linspace(0.1,2,14)**0.5,
                            width=12,
                            height=6,
                            n_ticks=7,
                            max_value=1.4,
                            bar_colors=['#99ff99','#c093d5'],
                            bar_fill_opacity=0.6,
                            bar_stroke_width=5,
                            bar_names='abcdefghijklmn')
        self.add(axes)
        # วาดแผนภูมิแท่ง
        self.play(
            mnm.Write(axes),
            run_time=1
        )
        # ปรับค่าแต่ละแท่งภายหลัง
        self.play(
            axes.animate.change_bar_values(np.zeros(14)),
            run_time=1
        )